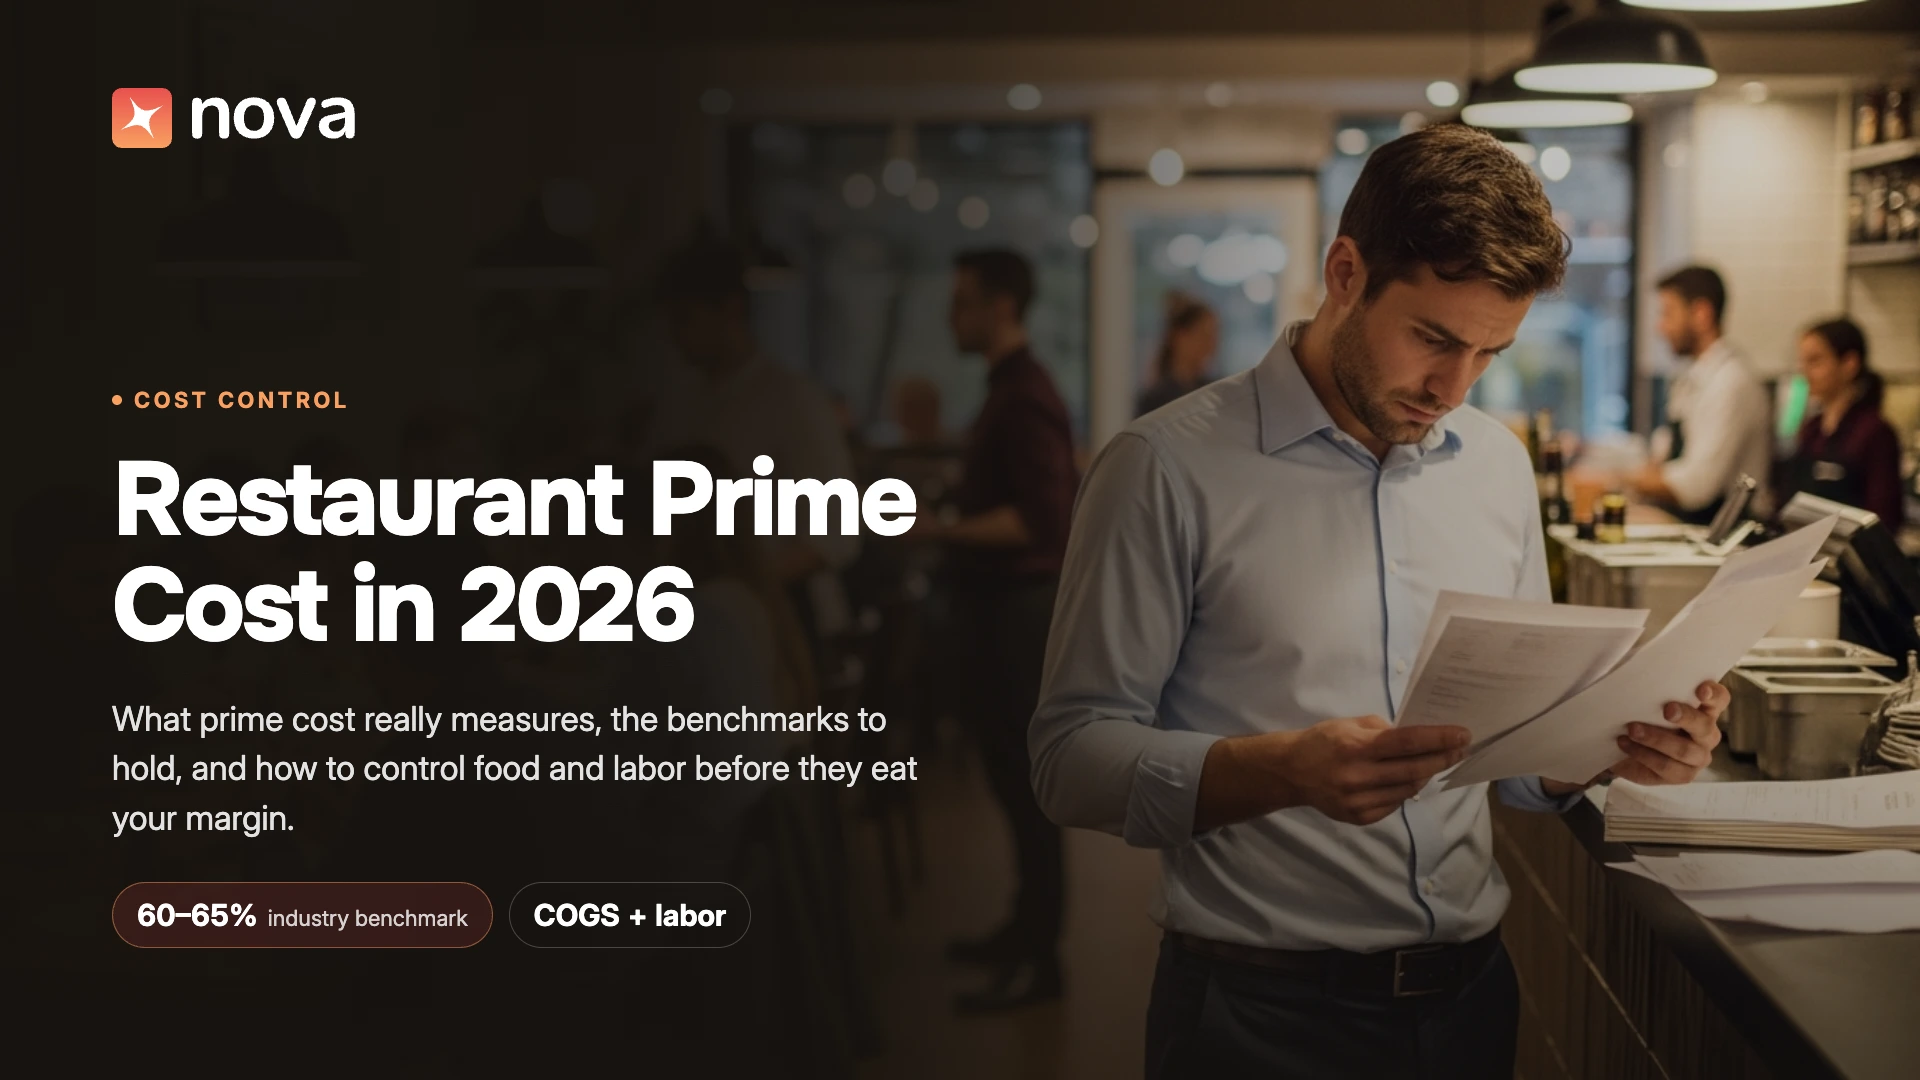
Restaurant Prime Cost in 2026: What It Is, Ideal Benchmarks & How to Control It for Higher Profits

Inflation remains the single biggest threat to profitability for U.S. restaurant operators heading through 2026. That's exactly why understanding and actively managing your restaurant prime cost matters more than ever. According to the National Restaurant Association, total expenses for the average restaurant have jumped 36% since 2019. Food and labor now each account for roughly 33 cents of every sales dollar, and other costs like occupancy, utilities, and card processing fees have posted double-digit increases over the same stretch. Meanwhile, the typical restaurant is still operating on a pre-tax margin of about 5%.
That combination - costs up more than a third while margins sit barely above break-even - means operators can no longer manage prime cost by gut feel. Winning in 2026 requires data-driven benchmarking, commodity-level cost awareness, AI-powered operations, and employee-focused practices that keep your two biggest controllable expenses in check. This guide walks through the full picture: what prime cost is, how it varies by segment and by scale, what's actually driving costs up right now, and a step-by-step method for calculating and controlling it.
What is Prime Cost?
Prime cost is the combined total of your two largest, most controllable expense categories: cost of goods sold (COGS) and labor.
Components:
- COGS (Cost of Goods Sold): All direct costs of selling food and beverages, including raw ingredients, packaging, and the transportation to get them into your kitchen.
- Labor Costs: Every direct and indirect workforce expense: wages, payroll taxes, benefits, bonuses, training, and uniforms.
Formulas:
- Prime Cost = COGS + Labor Cost
- Prime Cost % = (Prime Cost ÷ Total Sales) × 100
Because prime cost typically represents 55 to 65% of every sales dollar, it's the single biggest lever operators have over profitability, well ahead of rent, insurance, or any other line item. Everything else on the P&L (rent, insurance, marketing, admin) is comparatively fixed or slow-moving. Prime cost is the one category you can meaningfully change within a single week of operating decisions.
Restaurant Prime Cost in 2026: Industry Benchmarks
A single industry-wide target hides a lot of variation. Full-service restaurants carry a fundamentally different cost structure than quick service or fine dining, so a "good" restaurant prime cost looks different depending on your concept. Based on 2026 financial benchmark data from Toast, Restaurant365, and industry CFO advisory sources, here's how the numbers typically break down:
A few things worth flagging:
- Full-service labor cost has crept up. Industry benchmark data puts the full-service median at roughly 36.5% of sales, with only the most efficient operators holding labor near 34%.
- Anything under 55% deserves a second look. As several restaurant CFOs now put it, an operator running that lean "is either unusually efficient or understaffed," and understaffing shows up later as turnover and service quality costs.
- Anything over 65% is a structural problem, not a menu problem. If your prime cost is consistently above the top of your segment's range, no amount of portion size tweaking will fix it. The fix has to come from pricing, labor model, or supplier strategy.
- Beverage program mix changes your blended number. Beverage COGS typically runs 15 to 25% of beverage revenue, versus 30 to 40% for food. A restaurant with a strong bar or beverage program can pull its blended food cost percentage down meaningfully without changing a single food supplier.
COGS specifically should stay under 30 to 32% of sales for most segments. Anything higher usually points to portion drift, waste, or a supplier contract that hasn't been renegotiated in a while.
Prime Cost Benchmarks by Restaurant Scale
Segment isn't the only variable. A single location and a 50-unit group hit the same prime cost target for very different reasons, and treating them identically can mislead both.
Why the gap exists at scale:
- Purchasing power. Centralized vendor coordination across multiple units can reduce food cost variance by 2 to 4 percentage points through better negotiated pricing, something a single-unit independent typically can't access.
- Labor market variation. Multi-state operators face different wage floors in every market. California's fast food minimum wage sits well above Montana's, so a 20-unit group spanning both states needs location-level benchmarks, not one company-wide target.
- Delivery channel mix. Third-party delivery commissions run 15 to 30% per order, and as off-premise volume scales, effective COGS shifts differently depending on how much of the mix runs through delivery apps versus dine-in.
- Menu complexity at scale. Larger groups often introduce regional menu variations and limited-time offers, which increases portioning inconsistency across units if it isn't tightly controlled.
The operational takeaway: a 10-unit operator should be establishing location-level prime cost tracking, a 20-unit operator should be monitoring variance between units weekly, and a 50-unit operator needs to manage the distribution across markets and concepts, not just a single blended average.
Why Minimizing Prime Cost Matters in 2026
Rising minimum wages and ingredient costs continue to squeeze already thin margins. Independent restaurants average only about 3 to 5% profit, meaning a two or three-point swing in prime cost can be the difference between a profitable year and a break-even one.
Retention compounds the problem. Restaurant turnover has run between 73% and 80% annually over the past decade, per Bureau of Labor Statistics data compiled by Toast, well above the average for U.S. industries overall. The encouraging news: 2026 data from Restaurant365 shows 39% of operators hit their lowest turnover rates in three years, largely by investing in training and pay rather than relying on hiring volume to backfill losses. Since restaurant prime cost is the largest category of controllable expense, unlike rent or insurance, it's also the fastest lever to pull when margins tighten.
2026 Commodity Cost Pressures: What's Actually Driving COGS Higher
Generic "food costs are up" framing hides where the real pressure sits. Not every ingredient category is moving in the same direction in 2026, and knowing which ones are volatile changes how you should be sourcing and pricing.
Under sustained pressure:
- Beef: U.S. cattle inventories sit at multidecade lows, and the average price of breeding cattle has doubled relative to the 20-year average. Beef prices are expected to stay elevated through at least 2027, with domestic consumption projected to run 8% above the 20-year average even as production falls.
- Pork: Production is limited by a contracting breeding herd, and meaningful supply increases are unlikely before 2027.
- Eggs and poultry: Egg supplies remain below balanced levels after the industry lost more than 144 million birds since 2022.
- Dairy: A mixed picture. Milk and cheese supply may increase, but butter markets could tighten further if export demand stays strong.
Offering relief:
- Grains: Corn and wheat supplies are projected to stay abundant, keeping prices relatively low, good news for bakery, pasta, and grain-heavy menu items.
- Coffee, cocoa, and sugar: Broadly expected to decline in 2026, though coffee still faces volatility from tight global supply.
Food-at-home inflation reached nearly 3% in April 2026, compared with a pre-pandemic average closer to 2%, with meat categories driving most of the increase. Faced with this, operators are responding in a few consistent ways: 90% of full-service restaurants raised menu prices, 63% sourced alternative suppliers, and 60% removed underperforming menu items entirely rather than keep absorbing rising input costs on low-margin dishes. The practical implication for your COGS strategy: lean into grain-forward and produce-forward menu development where you can, watch beef- and egg-dependent dishes closely, and treat pricing and supplier diversification as standard tools rather than last resorts.
Calculating Your Prime Cost: A Worked Example
The formula is simple. Applying it well, and tracking it at the right frequency, is where operators get tripped up. Here's a full walkthrough using realistic monthly numbers, followed by a weekly view of the same restaurant.
Sample restaurant, one month:
- Total Sales: $150,000
- COGS (food and beverage purchases): $45,000
- Labor Cost (fully loaded, see burden rate below): $52,500
Prime Cost = $45,000 + $52,500 = $97,500
Prime Cost % = $97,500 ÷ $150,000 = 65%
That places this restaurant at the upper edge of the full-service range, worth investigating, not panicking over. If this operator trimmed prime cost by just 5 percentage points, to 60%, that's $7,500 back in margin in that month alone, or $90,000 over a year from the same sales volume, with no new customers required.
Now the same restaurant, tracked weekly instead of monthly:
Averaged out, the month looks like a clean 65%. But Week 2 spiked to 70.6%, likely a spoiled delivery, an overtime run, or a pricing error, and a monthly-only view would have buried that entirely inside an otherwise average result. A manager checking weekly would have caught it while there was still time to investigate and correct it, rather than discovering it a month later when the cash is already gone. This is the single biggest reason to move from monthly to weekly prime cost tracking: it turns a lagging indicator into a leading one.
The Labor Burden Rate Most Operators Miss
One of the most common prime cost errors is calculating labor cost using gross wages alone. Fully loaded labor cost includes payroll taxes, workers' compensation, benefits, and paid time off, and it's typically 1.10x to 1.35x the base wage total, depending on how much you offer in benefits.
A cook paid $20 an hour rarely costs the business just $20 an hour. With a 1.25x burden rate, the true cost is closer to $25 an hour. Multiply that gap across a full staff, and a restaurant that thinks it's running a 32% labor cost may actually be closer to 38 to 40%, which explains why some operators can't find where their "missing" margin went. Before you diagnose a prime cost problem as a menu or COGS issue, confirm your labor number already includes the full burden rate.
<table>
The ROI of AI on Prime Cost: What the 2026 Data Actually Shows
AI adoption for restaurant back-office work has moved from experimental to mainstream in a single year. 69% of operators now actively use or pilot AI for back-office reporting and analytics, according to Restaurant365's 2026 mid-year report, nearly triple the roughly 25% who did at the start of 2026. That's a fast adoption curve, and the same research quantifies what operators are actually getting from it:
- Inventory and purchasing automation: a 2 to 5% food cost improvement within 6 to 12 months.
- Labor forecasting and scheduling: a 5 to 15% labor cost reduction within 3 to 6 months. One tracked example showed labor cost decline from 34% to 30% of sales, a 4-point margin gain from scheduling alone.
- Food waste tracking: a 29% reduction in weekly waste in a sampled case, from roughly $850 to $600 per week.
- Menu engineering and P&L decision support: a 2 to 4% margin gain within 6 to 9 months.
- Voice automation and guest service bots: 10 to 20% time savings, typically showing ROI within 4 to 8 months.
Among operators using AI for cost management specifically, 61% report reduced food costs and 62% report reduced labor costs. The remaining holdouts cite data privacy concerns, accuracy worries, and cost as the main barriers, all reasonable, but increasingly the exception rather than the rule. The clearest pattern in the 2026 data: the operators seeing results are the ones measuring ROI weekly rather than quarterly, which lines up directly with the weekly prime cost tracking habit above.
Strategies to Control Prime Cost for Higher Profitability
Control COGS
Food costs remain volatile and increasingly commodity-specific, as detailed above. 82% of operators reported higher food costs in 2026, and the response mix (menu price increases, alternative sourcing, menu simplification) works best when it's deliberate rather than reactive.
- Portion Standardization: Document recipes and build Standard Operating Procedures so every plate uses the same ingredient quantities, regardless of who's on the line.
- Real-Time Inventory Tracking: Monitor stock continuously to catch expiring items, right-size orders, and stop over-ordering "just in case."
- Renegotiate Supplier Contracts Regularly: Review pricing quarterly, consolidate vendors, or join a group purchasing organization to offset inflation instead of absorbing it. This is especially valuable for beef- and egg-heavy menus given the supply pressure both categories are under.
Optimize Workforce Management
Labor pressure hasn't disappeared, but it is decelerating. 77% of operators reported labor cost increases in the first half of 2026, down sharply from 93% at the start of the year, and 61% expect further increases in the back half, the lowest forward-looking figure in three years. That's a real, if modest, easing, but with 19 states raising minimum wage on January 1, 2026 (from $10.85 an hour in Montana up to $17.13 an hour in Washington, with several states now above the long-sought $15 threshold), labor cost management is not getting easier for operators in higher-wage states.
Digital workforce management tools with AI-based scheduling are now table stakes rather than a nice-to-have. As the ROI data above shows, they're delivering measurable labor cost reductions by analyzing traffic patterns, sales history, and individual employee productivity to build schedules matched to actual demand rather than a manager's best guess.
Focus on Menu Development
Periodically analyze the menu to separate high-margin from low-margin items, best-sellers from laggards, and quick-prep dishes from labor-intensive ones. Cut the underperforming, complex items that eat prep time without earning their keep, and look for room to raise prices strategically on your highest-margin, highest-demand dishes rather than across the board. Given the commodity pressure on beef, pork, and eggs, this is also the moment to evaluate whether grain-forward or produce-forward dishes can take a larger share of the menu without hurting the guest experience.
Regularly Track Prime Cost
Consistent, at minimum weekly monitoring, not just at month-end, helps you catch spikes while there's still time to act, and makes it far easier to trace a spike back to its cause (a bad delivery, an unplanned overtime run, a pricing error) before it repeats. The worked weekly example above shows exactly why this matters in practice.
Ensure Employee Retention
Retention is genuinely improving for operators who invest in it. In 2026, training has overtaken pay as the most-cited retention strategy for the first time, used by roughly 32% of operators, narrowly ahead of competitive pay increases and improved work-life balance initiatives. That investment isn't cheap up front, the average cost to train a new restaurant hire now runs about $3,000, but it's still far less than the cost of repeating that training every few months for a revolving door of new staff.
Beyond the specific ROI figures above, digital tools give operators 360-degree visibility into prime cost components through advanced analytics and AI-powered pattern detection that a manual, spreadsheet-based process simply can't match at the same speed.
Frequently Asked Questions
What is a good restaurant prime cost percentage?
Most restaurants should target 55 to 65% of sales, with quick-service concepts closer to 55 to 60% and full-service or fine dining closer to 60 to 65%. Consistently running above 65% signals a structural cost problem rather than a one-off bad month.
What's the difference between prime cost and food cost?
Food cost (COGS) is only one half of prime cost, the ingredient side. Prime cost adds labor cost to food cost, since together they represent the two largest controllable expense categories in a restaurant.
How often should I calculate prime cost?
Weekly, at minimum. As the worked example above shows, a monthly calculation can bury a costly two-week problem inside an otherwise average month, delaying the fix and the recovered margin.
Does labor cost include payroll taxes and benefits?
Yes. A correctly calculated prime cost uses the fully loaded labor cost (wages plus payroll taxes, benefits, and workers' comp), typically 1.10x to 1.35x base wages. Using gross wages alone understates your true labor cost.
Is prime cost the same as controllable costs?
Prime cost is the largest component of controllable costs, but not the only one. Supplies, marketing, and some utility usage are also technically controllable, just far smaller than food and labor.
Does prime cost change based on how many locations I operate?
Yes. Multi-unit operators typically run 2 to 4 points lower on food cost thanks to centralized purchasing power, but face more complexity from labor market variation across states and higher exposure to third-party delivery commissions, which run 15 to 30% per order.
How much does beverage program mix affect prime cost?
Meaningfully. Beverage COGS typically runs 15 to 25% of beverage revenue versus 30 to 40% for food, so a strong bar or beverage program can lower your blended food cost percentage without any change to food suppliers.
How Nova Platform Helps You Control Prime Cost
Everything covered above (weekly tracking, fully loaded labor cost, commodity-level COGS pressure, AI-powered decisioning) points to the same conclusion: prime cost management has become too data-intensive for spreadsheets and end-of-month reports to handle well. That's the specific gap Nova is built to close. Nova is an AI native restaurant management platform that unifies front-of-house and back-of-house data into one system, so prime cost isn't something you reconstruct after the fact, it's something you can see as it happens.
Real-Time Prime Cost Visibility, Not Month-End Reconstruction
The worked example earlier in this guide showed how a single bad week gets buried inside an average month. NOVA solves that at the source by pulling sales, COGS, and labor data from the same connected system, so prime cost percentage updates continuously instead of waiting on a manual month-end close. Operators can see a spike the same week it happens, while there's still time to trace it to a cause and correct it.
Workforce Scheduling Built Around True Labor Cost
Most scheduling tools optimize against gross wages, which understates true labor cost by the 1.10x to 1.35x burden multiplier discussed above. NOVA's workforce module centralizes time tracking, break management, and overtime alerts, and factors the fully loaded cost, not just the hourly rate, into shift assignment. Overtime creep is one of the most common ways labor cost drifts from a planned 30 percent to an actual 38 to 40 percent without anyone noticing until the numbers are already in.
Inventory Management Tuned to Commodity Volatility
With beef, pork, and egg supplies under sustained pressure into 2027 and grain costs comparatively stable, generic inventory alerts aren't enough. NOVA provides real-time stock tracking, automated low stock alerts, and waste reporting, combined with AI-powered demand forecasting that adjusts as ingredient costs and usage patterns shift, so COGS stays inside its 30 to 32 percent target even as specific commodity categories move independently of each other.
Faster Onboarding to Protect the Retention Investment
Training now costs the industry roughly $3,000 per new hire, and that number only pays off if the employee stays. NOVA's onboarding interface is built to shorten ramp-up time so new staff reaches full productivity faster, which protects the retention investment covered in the strategies section above rather than letting turnover erase it.
Automated, Dispute-Free Tip Distribution
Tip disputes consume manager time and create friction that contributes to turnover. NOVA automates the calculation and distribution of tips across shifts and roles, removing a recurring source of both.
Menu Management With Margin Visibility Built In
Menu engineering only works if you know which dishes are actually profitable at current ingredient prices, not last quarter's. NOVA flags best sellers and lets operators push real-time price updates, so a strategic price increase on a high-margin item, or a decision to pull an underperforming dish, is based on current data rather than a quarterly spreadsheet review that's already out of date by the time it's finished.
Consolidated Reporting for Multi-Location Operators
For operators running 10, 20, or 50 units, the scale section above makes the case for location-level tracking rather than a single blended number. NOVA's reporting layer rolls up prime cost, food cost, and labor cost by location, so variance between units surfaces on a weekly basis instead of getting smoothed away in a company-wide average.
Want to see Nova in action? Book a free demo now.
Conclusion
With inflation still elevated, commodity pressure concentrated in beef, pork, and eggs, and minimum wage increases landing in 19 states this year, controlling your restaurant prime cost is no longer optional. It's the clearest lever operators have for protecting margin in 2026. That means tracking it weekly instead of monthly, using fully loaded labor numbers instead of gross wages, benchmarking against your specific segment and scale instead of a generic industry average, and leaning on AI-powered tools where the 2026 data shows they're actually moving the needle: 2 to 5% on food cost, 5 to 15% on labor cost, and real reductions in waste and admin time. Restaurants that treat prime cost as a real-time operating metric, not a month-end report, are the ones holding margin steady while the rest of the industry absorbs rising costs.